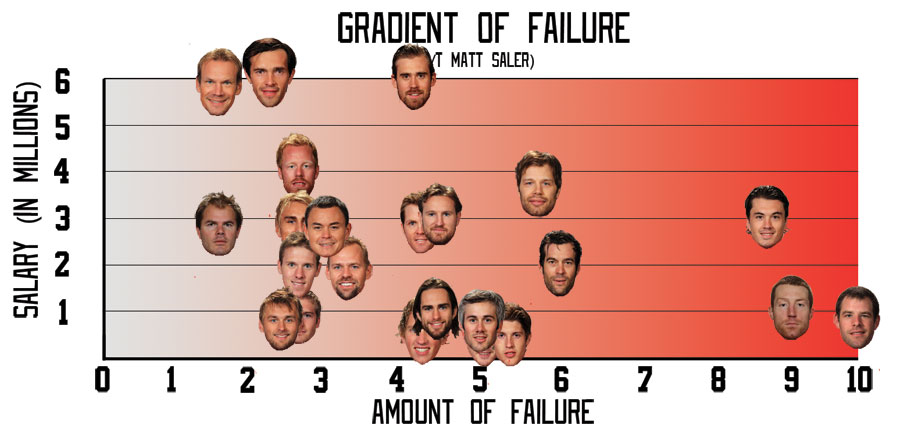
During the vicious rout at the hands of the Washington Capitals, Matt Saler from On The Wings coined the term “gradients of failure,” specifically in reference to performance on the power play. The term was too good to languish in Twitter archives. After some discussion and development, and a lot of time with Photoshop, we’re now prepared to reveal the official Gradient of Failure.
CLICK to enlarge.
The gradient plots salary of the player against player failure. Failure ranges from 0 (perfect humanesque) to 10 (shitboxian). We all assign a failure score to each player, and then those scores are averaged to come up with the final level of failure. That way when I constantly rate Helm at 1 and Petrella constantly rates Ericsson at 10, the subjectivity is balanced. We decided to plot against salary, because its a nice way to see what kind of bang we’re getting for the Wings’ buck. As players are brought up and sent down to the Griffins, I’ll add or remove them (Nyquist will join after playing tomorrow, Brunnstrom has been removed.)
Notes:
- Despite our general dissatisfaction with the team’s play, most everyone is below 5 (6 out of 23 players are above 5.) I don’t know whether this is because we’re being too nice, we blame everything on Ericsson and Conklin, or if we just don’t really know where the problem is.
- Conklin’s at Shitboxian Levels, two terrible games wiping out his previous shutout.
- IR is a tricky thing on the Gradient. We have Mursak at 5, since his preseason was impressive, but we have yet to see him play. He’ll sit on 5 until he returns.
- A 9 might be harsh for Commodore, seeing how he’s been injured, but he hasn’t impressed us much yet. His consistent refusals to answer our questions about appearing on TP:60 might have affected his score as well.
Look for this to update as the season continues.
There are some mornings where I open up this site and just can’t help but laugh. This is one of them. And I even knew it was coming.
Zetterberg has to be way higher.
Zetterberg and Clearly should definitely be higher.
Conklin should be lower; the guy is nearly playing for free. Have you looked at our offense? Even when Howard is in net, we cannot score. When Conklin is in net, we canot score. In short, we cannot score. All our goalies are able to do is to REDUCE the amount by which we’re losing. It’s flabbergasting that our -backup- goaltender is implicitly being blamed for this season’s terrible start. Then on top of that you implicate a guy (Commodore) who has barely played with us. Yikes.
This gradient makes no sense if its intent was to connect this team’s performance to the individual player’s performance. I’d peg this article as an 8 on your “gradient.”
How much we’re playing someone isn’t relevant on the Failure axis, that’s why there’s an axis solely for salary. So Conklin’s salary is reflected up there.
Also do I state ANYWHERE that this is supposed to reflect the team’s performance as a whole? No, that’s what points and standings are for. This is a way to evaluate individual player performance in a graphic. I think you might have less of an issue if you actually read the text accompanying the image.
Putting Conklin at a 10 doesn’t mean that we’re blaming 100% for the team’s failure, and I don’t know how you interpreted it that way. We’re just saying that we think a .882 save percentage and a 3.37 GAA is not great.
Did you even read the article: “The gradient plots salary of the player against player failure.”
And, no, Conklin has not played well. But his salary-to-performance ratio is by no means worse than, say, Zetterberg or Cleary.
At any rate, it strikes me as meaningless to create a salary axis if it has no effect on your “failure” gradient; doesn’t any objective, economic analysis crunch cost-benefit numbers? Anyway, this apparently was just a “for fun” article. I mistook it for a serious attempt at journalism. My bad.
Let’s be clear: there’s nothing objective about this gradient, especially if Mike Commodore is at a 9 because Petrella hates him for not coming on the podcast. Which, again, is clearly outlined in the text that corresponds to the gradient.
Also, there’s nothing that says salary doesn’t factor in to our individual ratings. Maybe it’s important to Disch, but not as important to me. The salary axis is there to serve as a reference point to the larger cap situation, since so many people correlate results based on pay scale. All we care about is feeling like the guys on the vertical axis are as far left as possible and any of the other lower paid guys are doing what they can to move left as well. How we get to that individual assessment is up to each of us, and we are all fine with that. Hell, we appreciate the comments and discussion that goes along with it too (even yours…bro.)
But again, you’re not reading this.
If you don’t like it, don’t come back! Thank you for your input.
I also WROTE the article, sunshine, so I can read it just fine.
There are floating disembodied heads on a graph with an X-axis labeled “amount of failure.” How could it be anything but a just “for fun” article?
We’ll be sure to plug that 8 into the next gradient. We’ll just put all four of our heads onto the 8 line, but since we get a vote for ourselves, i’m sure it’ll even out. That said, fair is fair (right?), so we think you should be on the gradient too. I’m thinking a picture of a big bag of dicks right on the 10 spot should do the trick.
Seriously, chill out. If you take this for gospel, you’re missing the point. It’s meant to be entertaining and 99% of everyone who saw this realized that. We’ll make sure they’re included on the gradient too. Don’t want to leave anyone out.
Also, this is a season-long, cumulative effort, which makes me wonder why you’re stuck on the last five games, given your multiple mentions of the Wings “not scoring.” I’d also suggest you read the text of the post regarding the Commodore rating, which would also enlighten you to the fact that HEY MAYBE THIS IS A JOKE!!!
Finally, do you hate fun? Should we drop “fun” on the 10 line as well?
Oh, so Cleary’s 2 points (both assists) over 10 games and a flashy -3 worth of defensive play warrant his rating of 4. Whatever, “bro” (is that chill enough).
Nevermind, I just realized this entire article was a joke and I shouldn’t take it seriously–or read it, for that matter. Thanks for clearing it up.
OK, OK. I’ll come to your side of the fence and play. Let me put on my serious face…
For both Zetterberg and Cleary, the voting total averaged a 4.33 (two 4’s and a 5). In this very (un)scientific process, points probably carry about the same weight in our mind as hustle, intangibles and how well the visor is worn do. Plus/minus is an absolute joke (especially THIS early in the season), as evidenced by Riggy Shitbox leading the league after two games. That said, if we go solely on stats, Dan Cleary ranks just below Henrik Zetterberg at 10th on the team in points and both find themselves in the middle of the pack on the gradient.
So essentially, the point production (one leg of your argument) jives with their position on the chart, plus/minus does not jive and would move them up in your mind, and our factor of effort, hustle, leadership and aforementioned visor wearing would offset the jump for (the meaningless) plus/minus. Thus, effectively putting them right in the ballpark of where they currently sit on the chart.
But what do you care? You’re not reading this, right?
Bro.
Comments are closed.